I've been asked a couple of times whether it is possible to integrate charts with flashChart in "normal" web applications. This has always been possible however since version 1.2.1 of flashchart it is much easier.
This article describes how to use the interfaces of flashChart for web applications. With a sample application it is explained step by step what is needed to integrate diagrams in Web applications. To understand this article it is necessary to have some basic knowledge of HTML and the scripting language PHP
{tab Overview|primary}For such an application you do not need necessarily the CMS Joomla! you only must provide the following FlashChart program components
- the Open Flashchart SWF-File "open-flashchart.swf"
- FlashChart's library files"../flashchart/lib/.."
- FlashChart's Javascript files "../flashchart/js/.."
- FlashChart's style sheets files "../flashchart/css/.."
Most web applications run under the control of an HTTP server (eg Apache) and usually generate HTML code for a web page. The HTTP server then sends on request this web page to a client, for example, a browser like Firefox or Internet Explorer. Our sample application will use exactly this application infrastructure
First, we define our PHP program infrastructure so that all required libraries can be found:
// do not allow direct access
defined('_JEXEC') or die('Restricted access');
$basepath = JPATH_SITE; // with jumi you can use Joomla API
$flashchart_root = "/plugins/content/flashchart";
$lib_path = $basepath . $flashchart_root . "/lib/";
We can then include FlashChart's libraries to integrate them for use with our application:
$lib = $lib_path . "flashchart_class.php";
require_once ($lib);
Important Notes:
With Release 1.2.2 of flashChart php-scripts will be checked, wether the Joomla Framework is used. This means that direct calls outsite the framework will fail with an error.("Restricted Access"). You may avoid this problem implementing following solutions:
- If your application runs under Jooomla framework
- use Joomla extensions e.g. "jumi"
- run your application from directory "../templates/system/":
1. copy "your-application-script.php" to "../templates/system"
2. URL for your application will then be../index.php?option=com_content&tmpl=your-application-script
Important! To prevent direct access, do not forget to code a very first statement in your program:
defined('_JEXEC') or die('Restricted access'); - If your application does not run under control of Joomla or not with Joomla at a all
Define use of Joomla's framework explicitly prior including "flashchart_class,php":define('_JEXEC', 1);
{tab The Chart Object|primary}
The basic concept of flashChart is to implement an object oriented approach - so we will not progam a chart we instead assign attributes (properties) to a chart object.
Once this object has been created and assigned its properties it may be displayed, created as script or displayed in a modal window.
This means that you basicly need only three program interfaces:
...
$chart = new flashChart("chart01");                // creates a chart object "$chart" with default attributes
$chart->setChartProperty("attribute", "value"); // assignes a chart attribut (property)
$chart->createChart();                                  // creates (displays) a chart
...
To create a chart object you will use the constructor "flashchart":
flashChart($chartid, $properties_file = null, $width = "100%", $height = "100%")
The constructor "knows" these parameters:
- "chartid" - die Chart-Id (always required)
- "properties-file" - default = "null" (no properties file - use default chart attributes)
- "width" - width of chart (default = "100%")
- "height" - height of chart (default = "100%")
If you code
$chart = new flashChart("mychart-id");
you will create chart object "$chart" and use {flashchart data="popup_window" url="/php-apps/flashchart/samples/default_props.html" width="800" height="500" title="default properties"}listing{/flashchart} and will define a width and height of 100% for your chart.
If you want to use your own properties-file you will have setup your coding in a similar way as shown below:
$chart = new flashChart("mychart-id", "$basepath . "/html/my_properties.props");
Here you see {flashchart data="popup_window" url="/php-apps/flashchart/samples/flashchart_props.html" width="800" height="560" title="the format and content of an own properties file."}own_props{/flashchart} All chart attributes ("properties") are identical with their names and content, which you know from FlashChart plugin for Joomla!. You will find a description of all supported parameters (names and properties) in FlashChart's Reference and Tutorial.
Chart attribute can be set and retrieved by "setter" und "getter" methods of your created chart object:
| Method | Description | Return value |
| setChartProperty($key, $value) | Sets an attribute with the name "$key" and value "$value" | "1" - OK or error message |
| getChartProperty($key) | Returns an attribute with the name "$key" | property or null |
| setChartProperties($properties) | Sets all attributes with the contents of the array "$properties" | "1" - OK or error message |
| getChartProperties() | Returns all flashchart attributes in an array | array |
| setDefaultProperties() | Sets all chart attributes to their (internal) default | n/a |
| setChartWidth($width) | Sets the width of the chart to "$ width" | n/a |
| getChartWidth() | Returns width of chart in pixel or percent | width |
| setChartHeight($height) | Sets the height of the chart to "$height" | n/a |
| getChartHeight() | Returns height of chart in pixel or percent | height |
| setChartId($chartid) | Sets chart-Id of chart to "$chartid" | n/a |
| getChartId() | returns chart-Id of chart | chart id (string) |
| getJavascripts() | Returns the HTML code of all necessary javascripts | HTML (strings) |
| createChartasScript($script) | Generates the chart as JavaScript with the name "$script | javascript (strings) |
| createChart() | Generates the chart for display | javascript (strings) |
| createChartasModal($link,$close, $title) | Creates a modal chart and asigns a a link to it. Parameter "$close" (default "Close") adds a title tag to the close button. With parameter "$title" you may add a title into the head of your popup. | html-tags and return code ("1" - OK) or error message |
With these informations we can now complete our web application.
{tab Web Application (1)|primary}We will at first code an application that will create a simple chart with own chart data. The chart should not be displayed directly but created as modal window with a link in this web page.
After we have defined the program environments, we create our chart object. Then we call for all necessary javascripts as html-code and define a stylesheet (CSS) for modal windows.
// create new chart object (use all provided defaults)
$chart = new flashChart("chart01", null, "450", "250");

// add javascripts and stylesheet for modal chart
$html = $chart->getJavascripts();
$urlpath = $chart->getChartProperty('url_path');
$html .= "<link href='$urlpath/css/bootstrap-modal.css' rel='stylesheet' type='text/css' />";
Our chart of course needs some data and a title:
// set selected chart properties
$chart->setChartProperty("title", "Chart via testApp0.php");
$chart->setChartProperty("data", "50,60,70,80,90,60|109,120,100,130,140,100");
The chart and a link to it is made via "createChartasModal()":
// render (imbed) chart into html
  $html .= $chart->createChartasModal("testApp0 <b>(Modal Chart)</b>", "Close", "testApp0 - Modal Chart");
As a last step, the HTML code is completed and forwarded to the HTTP server:
//send genned html
echo $html;
Now our little web application is ready to be used. The display of the program code of application has been made available with flashchart tag data="popup_window".
The application has been embedd and is callable via Jumi Plugin:
- {flashchart data="popup_window" title="Listing of programm testApp0.php" width="685" height="400" url="/php-apps/flashchart/samples/testApp0-listing.html"}listing_testApp0{/flashchart}
- {jumi [php-apps/flashchart/samples/testApp0.php]}
Our application is of course very rudimentary. It was indeed the aim to explain the principle how diagram objects can be imbedded in such an application. The application will now be extended and we will explain how to provide data for chart objects.
We complement our web application with an HTML form, which is generated by a separate function ("createHTMLform"). Via a selection menu we will create a chart based on different datasources. {flashchart data="popup_window" title="(here the programm listing)" width="450" height="250" url="/php-apps/flashchart/samples/testApp1-listing1.html"}listing1{/flashchart}. With this we will show how you may feed data into diagrams and how to use chart menus.
The request for data ist indentical to FlasChart Plugin for Joomla - the type of datasource will be defined by attribut (property) "data":
- "database" - request data from Mysql database
- "file" - request data from File
- "url" - request data from local ore remote WebServer
- "formula" - generate data via a mathematical formula
- or you define your data direcly via "data" - property (as shown in PHP-Script "testApp0.php" above)
Following scheme shows required properties for requesting chart's data:
| Mysql Database | $chart->setChartProperty("db_config_file", $dbconfig_file); $chart->setChartProperty("data", "database"); $chart->setChartProperty("sql", $sql); |
| file | $chart->setChartProperty("data", "file"); $chart->setChartProperty("file", $file); |
| url | $chart->setChartProperty("data", "url"); $chart->setChartProperty("url", "$url"); |
| formula | $chart->setChartProperty("data", "formula"); $chart->setChartProperty("formula", "$formula"); set processing options for formula: $chart->setChartProperty("x_min", "$x_min"); $chart->setChartProperty("x_max", "$x_max"); $chart->setChartProperty("x_interval", "$x_interval"); |
| data | $chart->setChartProperty("data", "label and data"); |
Format of data has to be provided always in this form:
"label-1,label-2,label-3,...label-n / number-1, number-2, number-3,...,number-n" or "number-1, number-2, number-3, ...number-n".
The above scheme shows that you have to enable database access via a "DB-configfile". This file is a small PHP script with all the necessary database parameters. If you want to access the Joomla! MySQL database you may use the Joomla! configuration file "configuration.php". Here is an example of a separate configuration file (eg named "my_dbconfig.php"):
<?php
/* --------------------------- */
/* file: my_dbconfig.php     */
/* --------------------------- */
class  JConfig  {

	var $host = 'localhost';
	var $user = 'my_dbuser';
	var $db = 'my_database';
	var $password = 'my-password';
}
?>
Our application accesses the Joomla! database and uses Joomla's configuration file. The PHP code for the definitions necessary to access this database look like this:
// use Joomla's Configfile and define sql statement
$dbconfig_file = $basepath . "/configuration.php";
$chart->setChartProperty("db_config_file", $dbconfig_file);
$sql = "Select title, hits From jos_content Order By hits Desc Limit 10";
$chart->setChartProperty("data", "database");
$rc = $chart->setChartProperty("sql", $sql);
The method "setChartProperty" returns a return code. If the setting of an attribute has been successfully "true" will be returned - "false" indicates an error situation (you may see error messages as well). Especially in the setting of data attributes, it is useful to review the success of "data feeds".
Now back to our application! The application logic is relatively simple:
- Dispay a selection menu
- depending on user input display four scenarios:
- Data from Database
- Data from Webserver
- Data from File
- Data via formula
- Display of all charts via chart menu
For the implementation of chart menu, the property "menu" is set and we will call the method "createChartasScript":
..
$chart->setChartProperty("menu", "Data via Database,sql_chart|Data via URL,url_chart|Data via File,file_chart");
...
$html .= $chart->createChartasScript("sql_chart");
..
All User actions will be stored in PHP-environmental-variable "$_POST". Based on sitiuation we will retrieve its content and react accordingly. With all this information, our program can now be completed.
- {flashchart data="popup_window" title="testApp1.php" width="620" height="300" url="/index.php?option=com_jumi&view=application&fileid=14&format=raw"}liste{/flashchart}
- view complete PHP-Script testApp1.php
Have a try to make these two apps run on your site and/or develop similar ones.
{tab flashChart and AJAX |primary}Ajax (an acronym for Asynchronous JavaScript and XML) is a group of interrelated web development techniques used on the client-side to create asynchronous web applications. With Ajax, web applications can send data to, and retrieve data from, a server asynchronously (in the background) without interfering with the display and behavior of the existing page. Despite the name, the use of XML is not required (JSON is often used instead), and the requests do not need to be asynchronous.
{tab-level2 Ajax Applications|info}Ajax is not a single technology, but a group of technologies. HTML and CSS can be used in combination to mark up and style information. The DOM is accessed with JavaScript to dynamically display, and allow the user to interact with, the information presented. JavaScript and the XMLHttpRequest object provide a method for exchanging data asynchronously between browser and server to avoid full page reloads.
Flashchart since version 1.2.1 (with its chart object class) supports Ajax on the server site with additional methods and as well on the client site with its javascript interfaces.
{tab-level2 requestFlashchartData|info}Javascript Function "requestFlashchartData"
An Ajax-application always consists of a client- and a server-part. The client requests data via Javascript (in case of flashChart in JSON-Format) from a server application. These data will be processed by a callback-function and then presented by a the client application. The Javascript function "requestFlashchartData" has exactly all this functionality. It only needs as input a valid URL of the server application. For updating the presented web page you must provide following nodes (div-Elements):
- "html_text" - for updateing of HTML-Code
- chart ids - for charts
- "flashchart_scripts" - for chart scripts
Server Support for Ajax-Applications
Flashchart's Ajax Interfaces will use JSON Data format - following methods will create/present Flashchart JSON-Objects:
| Method | Description | Return Value |
| createChartasJSON() | Creates a chart as JSON Object | n/a |
| createChartasJSONScript($script) | Creates a chart script as JSON Object | n/a |
| createHTMLasJSON($html,$node='html_text') | Creates HTML-Strings as JSON Object ("$node" defines a required div-element)" | n/a |
| getJSON() | Requests all created JSON Objects | JSON Objects |
{tab-level2 Sample Ajax Application|info}
Here the sample from previous page but now built as Ajax-application:
{jumi [php-apps/flashchart/samples/testApp2a.php]}
The Sample Ajax Application has been installed and setup for Joomla extension "jumi", it therefore runs under control of Joomla's Frameworks. The client php-script is called via via jumi-plugin within this page. The server part has been defined via Admin-Backend with the jumi-component. You may study the source code and see how all functions have been implemented.
The client-part has following application logic:
- Define environment
- Build Javascripts - e.g. use "requestFlashchartData" with Javascript-Function "processFormResults"
- build HTML - e.g. div-elements for charts, javascripts and HTML
The Server Part creates HTML, charts and javascripts in JSON-format based on request of client and then sends the data with method "getJSON()" to the client. {tab-level2 Source (Client Part)|info}
<?php
// do not allow direct access
defined('_JEXEC') or die('Restricted access');
// setup environment ($server_url is setup based on jumi and its fileid)
$server_url = "/index.php?option=com_jumi&view=application&fileid=27&format=raw";
$urlbase = JURI::base() . "plugins/content/flashchart";
// create javascript and css resources
$html = "\n<script type='text/javascript' src='" . $urlbase . "/js/jquery.min.js' ></script>";
$html .= "\n<script type='text/javascript' src='" . $urlbase . "/js/swfobject.js' ></script>";
$html .= "\n<script type='text/javascript' src='" . $urlbase . "/js/flashchart.js' ></script>";
$html .= "\n<script type='text/javascript' src='" . $urlbase . "/js/jquery_msgbox.js' ></script>";
$html .= "\n<link href='" . $urlbase . "/css/msgbox.css' rel='stylesheet' type='text/css' />";
$qq = '"';
$script = "function processFormResults (form) {
var Item = form.chart.selectedIndex;
var chart = form.chart.options[Item].value;
var url = '$server_url' + '&chart=' +chart;
var loading_info = document.getElementById('html_text');
var loading_html = '<div align=center><img src="/ . $qq . $urlbase . '/images/loading.gif' . "$qq /></div>';
loading_info.innerHTML = loading_html;
// send ajax request:
requestFlashchartData(url);
}";
$html .= "\n<script type='text/javascript'>" . $script . "</script>";
// create html form
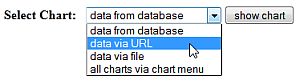
$html .= "<form action='' name='test_ajax'>
<b>Select Chart:</b>
<select name='chart'>
<option value='sql'>data from database</option>
<option value='url'>data via URL</option>
<option value='file'>data via file</option>
<option value='formula'>data via formula</option>
<option value='menu'>all charts via chart menu</option>
</select>
<input type='button' value='show chart' class='button' onclick='processFormResults(this.form)' />
</form>
<!--- Nodes for html, charts and scripts: reserved/needed names are 'html_text' and 'flashchart_scripts' -->
<div id='html_text'></div>
<div id='charts'>
<div id='chart_ajax'></div>
</div>
<div id='flashchart_scripts'></div>";
// output html
echo $html;
?>
{tab-level2 Source (Server Part)|info}
<?php
// setup environment
defined('_JEXEC') or die('Restricted access');
$basepath = JPATH_SITE;
$flashchart_root = "/plugins/content/flashchart";
$lib_path = $basepath . $flashchart_root . "/lib/";
require_once ($lib_path . "flashchart_class.php");
// create new chart object (use default properties)
$chart = new flashChart("chart01", null, "90%", "300");
$chart->setChartProperty("flashchart_root", $flashchart_root);
$selection = $_GET['chart'];
$chart->setChartProperty("label_fontsize", "11");
$chart->setChartProperty("bg_color", "f9f9f9");
$chart->setChartProperty("bg_image", $flashchart_root . "/images/watermark.png");
$menu = "Data via Database,sql_chart|Data via URL,url_chart|Data via File,file_chart|
Data via Formula,formula_chart";
if ($selection == "menu")
{
$chart->setChartProperty("menu", $menu);
$chart->createHTMLasJSON("<br/ >All Charts via <b>chart menu:</b>");
}
if ($selection == "sql" || $selection == "menu")
{
// use Joomla's Configfile and define sql statement
$dbconfig_file = $basepath . "/configuration.php";
$chart->setChartProperty("db_config_file", $dbconfig_file);
$sql = "Select title, hits From jos_content Order By hits Desc Limit 10";
$chart->setChartProperty("x_label_rotate", "40");
$chart->setChartProperty("data", "database");
$rc = $chart->setChartProperty("sql", $sql);
$chart->setChartProperty("type", "bar_dome");
$chart->setChartProperty("tooltip", "#val# hits");
$chart->setChartProperty("title", "Chart Data from Database (most read articles)");
if ($selection == "menu")
$chart->createChartasJSONScript("sql_chart");
else
$chart->createHTMLasJSON("<br/ >Chart data via <b>sql</b>="$sql":");
}
if ($selection == "file" || $selection == "menu")
{
$file = $basepath . "/php-apps/flashchart/samples/square.data";
$chart->setChartProperty("x_label_rotate", "0");
$chart->setChartProperty("data", "file");
$rc = $chart->setChartProperty("file", $file);
$chart->setChartProperty("x_step", "10");
$chart->setChartProperty("y_step", "8");
$chart->setChartProperty("axis_3d", "0");
$chart->setChartProperty("type", "line");
$chart->setChartProperty("tooltip", "x=#x_label# -> y=#y#");
$chart->setChartProperty("title", "Chart Data from File (square values)");
if ($selection == "menu")
$chart->createChartasJSONScript("file_chart");
else
$chart->createHTMLasJSON("<br/ >Chart data via <b>file</b>="$file":");
}
if ($selection == "url" || $selection == "menu")
{
$url = "http://www.jschmidt-systemberatung.de/php-apps/flashchart/samples/sinus.php";
$chart->setChartProperty("data", "url");
$rc = $chart->setChartProperty("url", "$url");
$chart->setChartProperty("x_label_rotate", "0");
$chart->setChartProperty("x_step", "9");
$chart->setChartProperty("y_step", "0.2");
$chart->setChartProperty("y_min", "-1");
$chart->setChartProperty("axis_3d", "0");
$chart->setChartProperty("type", "line_area");
$chart->setChartProperty("tooltip", "sinus #x_label# = #y#");
$chart->setChartProperty("title", "Chart Data from Remote WebServer (sinus from 0 to 360 degrees)");
if ($selection == "menu")
$chart->createChartasJSONScript("url_chart");
else
$chart->createHTMLasJSON("<br/ >Chart data via <b>url</b>="$url":");
}
if ($selection == "formula" || $selection == "menu")
{
// set selected chart properties
$formula = "y = 2 * e^-(0.2 * x) * sin(x * 2 * pi)";
$chart->setChartProperty("title", "Chart Data created via Formula");
$chart->setChartProperty("type", "line");
$chart->setChartProperty("axis_3d", "0");
$chart->setChartProperty("y_step", "0.5");
$chart->setChartProperty("x_step", "10");
$chart->setChartProperty("x_interval", "0.1");
$chart->setChartProperty("x_max", "20");
$chart->setChartProperty("y_min", "-2");
$chart->setChartProperty("tooltip", "x=#x_label# y=#y#");
$chart->setChartProperty("data", "formula");
$rc = $chart->setChartProperty("formula", $formula);
if ($selection == "menu")
$chart->createChartasJSONScript("formula_chart");
else
$chart->createHTMLasJSON("<br/ >Chart data via <b>formula</b>="$formula":");
}
// create empty chart if "menu" requested
if ($selection == "menu")
{
$chart->setChartProperty("data", "null");
$chart->setChartProperty("y_min", "null");
$chart->setChartProperty("grid_color", "f9f9f9");
$chart->setChartProperty("tooltip", "");
$chart->setChartProperty("title", "Charts via Chart Menu");
}
if ($rc == 1)
{
$chart->createChartasJSON ();
}
else
{
$data['data_type'] = 'error_data';
$data['error_title'] = "Processing Error";
$data['error_msg'] = "could not set chart property for $selection ($rc)";
echo json_encode($data);
return;
}
echo $chart->getJSON ();
?>
{/tabs}
{/tabs}
Any questions? Ask them!
Have Fun!